Toggle Menu
Menu
ClassNotes
Prepare Standardized Tests
Notes & Solved Past Papers
Shop
Tutors
Company
Search ClassNotes...
Search...
Ctrl
K
Command Palette
Search for a command to run...
Become a Tutor
Toggle layout
Toggle theme
Home
/
Prepare
MCQs
Show
Per Page
To earn money for college, Avery works two part-time jobs: A and B. She earns $\$10$ per hour working at job A and $\$20$ per hour working at job B. In one week, Avery earned a total of $s$ dollars for working at the two part-time jobs. The graph above represents all possible combinations of a number of hours Avery could have worked at the two jobs to earn $s$ dollars. What is the value of $s$?
Math
Algebra
The shaded region shown represents solutions to an inequality. Which ordered pair $(x,y)$ is a solution to this inequality?
Math
Algebra
The graph below shows the distance traveled $d$, in feet, by a product on a conveyor belt $m$ minutes after the product is placed on the belt. Which of the following equations correctly relates $d$ and $m$?
Math
Algebra
The graph shows the relationship between the number of shares of stock from Company A, $x$, and the number of shares of stock from Company B, $y$, that Simone can purchase. Which equation could represent this relationship?
Math
Algebra
$ax+by=b$
In the equation above, $a$ and $b$ are constants and $0<a<b$. Which of the following could represent the graph of the equation in the $xy$-plane?
Math
Algebra
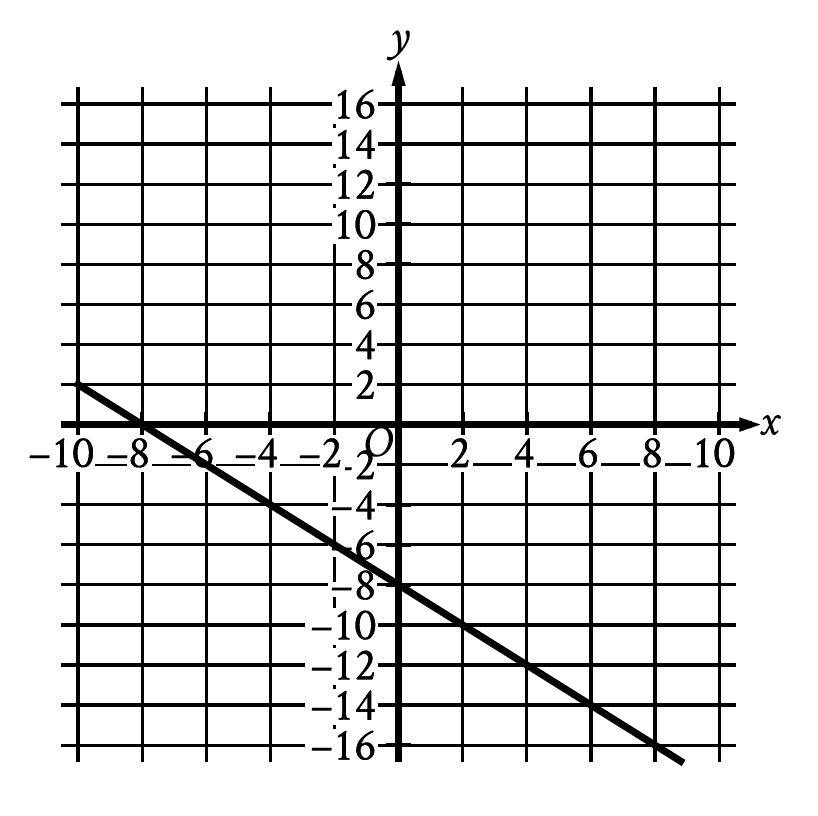
What is the equation of the graph shown?
Math
Algebra
The cost $y$, in dollars, for a manufacturer to make $x$ rings is represented by the line shown.
What is the cost, in dollars, for the manufacturer to make 60 rings?
Math
Algebra
The graph shows the possible combinations of the number of pounds of tangerines and lemons that could be purchased for $\$18$ at a certain store. If Melvin purchased lemons and 4 pounds of tangerines for a total of $\$18$, how many pounds of lemons did he purchase?
Math
Algebra
The graph of $y=f(x)+14$ is shown. Which equation defines function $f$?
Math
Algebra
The graph shown models the number of candy bars a certain machine wraps with a label in $x$ seconds.
According to the graph, what is the estimated number of candy bars the machine wraps with a label per second?
Math
Algebra
A system of two linear equations is graphed in the $xy$-plane below.
Which of the following points is the solution to the system of equations?
Math
Algebra
The graph of the function $f$, where $y=f(x)$, gives the total cost $y$, in dollars, for a certain video game system and $x$ games. What is the best interpretation of the slope of the graph in this context?
Math
Algebra
$x+5y=5$
$2x-y=-4$
Which of the following graphs in the $xy$-plane could be used to solve the system of equations above?
Math
Algebra
Which of the following is an equation of the graph shown in the $xy$-plane below?
Math
Algebra
The line graphed in the $xy$-plane below models the total cost, in dollars, for a cab ride, $y$, in a certain city during nonpeak hours based on the number of miles traveled, $x$.
According to the graph, what is the cost for each additional mile traveled, in dollars, of a cab ride?
Math
Algebra
The graph of a system of linear equations is shown. What is the solution $(x,y)$ to the system?
Math
Algebra
$x$
$y$
$0$
$0$
$1$
$1$
$2$
$8$
$3$
$27$
The table shown includes some values of $x$ and their corresponding values of $y$. Which of the following graphs in the $xy$-plane could represent the relationship between $x$ and $y$?
Math
Advanced Math
Scientists recorded data about the ocean water levels at a certain location over a period of 6 hours. The graph shows the data, where $y=0$ represents sea level. Which table gives values of $x$ and their corresponding values of $y$ based on the model?
Math
Advanced Math
A system of equations consists of a quadratic equation and a linear equation. The equations in this system are graphed in the $xy$-plane above. How many solutions does this system have?
Math
Advanced Math
The rational function $f$ is defined by an equation in the form $f(x)=\dfrac{a}{x+b}$, where $a$ and $b$ are constants. The partial graph of $y=f(x)$ is shown. If $g(x)=f(x+4)$, which equation could define function $g$?
Math
Advanced Math
$f(x)=x^{2}+4$
The function $f$ is defined as shown. Which of the following graphs in the $xy$-plane could be the graph of $y=f(x)$?
Math
Advanced Math
The quadratic function graphed above models a particular measure of plant diversity as a function of the elevation in a region of Switzerland. According to the model, which of the following is closest to the elevation, in meters, at which plant diversity is greatest?
Math
Advanced Math
What is the $y$-intercept of the graph shown?
Math
Advanced Math
What is the $y$-intercept of the graph shown?
Math
Advanced Math
$y=4(2^{x})$
Which of the following is the graph in the $xy$-plane of the given equation?
Math
Advanced Math
Previous
1
More pages
13
14
15
16
17
More pages
Next