
Biostatistics:
Biostatistics is the application of statistical methods and principles to analyse and interpret the findings of biological, medical and health sciences. Biostatistics mainly deals with the collection, analysis and interpretation of data associated to living organisms and then presentation of findings for possible plans or solutions. Biostatistics is applicable to multiple fields of life sciences particularly health, medicine and agriculture.
Biostatistics help in estimation and calculation of productivity of agriculture, poultry and dairy farming. It is essential part of modern health science; it is used in multiple areas of public health including medicine, epidemiology and research. It plays a crucial role in understanding the disease outbreaks, health trend, possible preventive measure and effectiveness of specific treatment.
Components of Biostatistics studies:
In biostatistics studies, following steps or components are followed:
- Identification of problem:
It is first ever parameter to observe any specific issue affecting the living organisms especially human. - Designing experiments:
For the solution of any specific issue, one must plan how to conduct biological experiments. - Collecting and analysing data:
Data collected from the experiments is analyzed thoroughly. - Interpreting results:
Observed reasons and possible future effects are calculated on the basis of data collected from the experiments. - Developing new tools:
Interpretation of experimental results lead to creating new tools or plan for dealing the problem e.g. health related issues.
It is highly recommended for every biologist to have at least some basic understanding or learning of biostatistics.
Uses of Biostatistics:
I. Agriculture and cattle farming needs for growing population:
Biostatistics is involved in the assessment of demands of agriculture and dairy farming according to the rate of population growth. Furthermore, it also helps the government to assess the need for import or export of food items as per growing population.
ii. Medical and Pharmacological Research:
Biostatistics helps to design clinical trials and controlled studies to assess the efficacy and safety of newly designed drugs, treatment plan or medical instrument. Findings of medical research guide whether treatment resulted to improvements or side effects. Assessment of the effectiveness and safety of new drugs and deciding optimal doses for any new pharmacological drug.
- Epidemiological studies and Policy Development:
Biostatistics help in monitoring and analysis of data collected from population about the spread of any epidemic disease. Researchers can identify the risk factors, pattern and rate of disease. Epidemiological studies by using biostatic tools help to control and prevent future outbreaks (e.g., prevalence of Hepatitis and Polio, spread of COVID-19 etc.). Biostatistics evidence helps governments and public organizations to make decisions about population management, healthcare strategies and funding sources. - Management of Public Health:
Each country conduct biostatics studies to estimate health trends within its population. Routine studies include data about birth rates, death rates and prevalence of different disease. It guides the government in planning health initiatives and allocation of resources for public. Biostatistics is useful to monitors and optimize the hospital performance by calculating patient number, availability of doctors and medicine and effectiveness of treatment. - Genetic diseases:
Biostatistics is also useful to analyse the data about inheritance patterns of genetic diseases in any population. For example, number of thalassemia and muscular dystrophy patients. It helps in guessing risk factors and behaviour of genetic disorders - Pollution indicators and Environmental protection:
Biostatistics is used to analyse the pollution level, its causes and impact on population health. Different biostatic tools are designed to monitor the pollution level and potential health risks, it helps in designing policies to reduce health risks from environmental hazards. On the basis of findings, multiple steps are taken to protect the environment. For example, causes of smog, identification of affected areas, possible solution like plantation derives in Punjab especially in Lahore. - Survival Analysts:
Biostatistics is used to predict and then note the survival rate of patients after a particular treatment. It helps to estimate life expectancy and the chances of success for medical treatments. For example, five years survival after the treatment of cancer is considered a successful treatment.
Arithmetic Mean or simply Mean:
Definition:
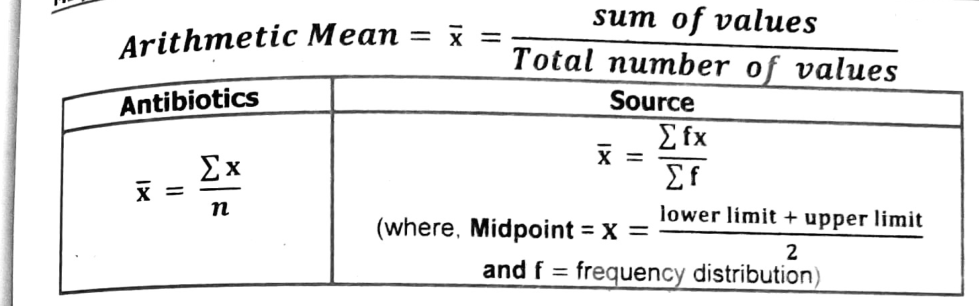
Mean is the sum of all the values of data set divided by the total number of values in the data set. It is the single value which is calculated to represent the whole set of data. The symbol “$\bar{x}$” (read as “x bar”) represent the sample mean. The bar above the letter x represents the mean of a set of values.
Arithmetic Mean $=\bar{x}=\dfrac{\text{sum of values}}{\text{Total number of values}}$
| Antibiotics | Source |
|---|---|
| $\bar{x}=\dfrac{\sum x}{n}$ | $\bar{x}=\dfrac{\sum fx}{\sum f}$ (where, Midpoint $=X=\dfrac{\text{lower limit + upper limit}}{2}$ and $f=$ frequency distribution) |
Example: Arithmetic Mean (un-group data)
Dataset: Team of world health organization (WHO) planned to assess the prevalence of polio disease in Pakistan. Study to record the polio cases in Pakistan continued for consecutive two years. Number of confirmed Polio patients detected each month of 2022 and 2023 are given in table below. Calculate the mean polio patients per month in each year. Also compare the prevalence of Polio disease in both years.
| Sr. no. | Month | Number of Polio patients in year 2022 | Number of Polio patients in year 2023 |
|---|---|---|---|
| 1 | January | 9 | 7 |
| 2 | February | 13 | 9 |
| 3 | March | 15 | 13 |
| 4 | April | 19 | 17 |
| 5 | May | 22 | 18 |
| 6 | June | 25 | 17 |
| 7 | July | 20 | 15 |
| 8 | August | 22 | 14 |
| 9 | September | 18 | 11 |
| 10 | October | 13 | 9 |
| 11 | November | 10 | 8 |
| 12 | December | 6 | 6 |
| Total | 12 months | 192 | 144 |
Mean number of Polio patients per month in 2022
Sum of Polio cases in complete year $=\dfrac{\text{Sum of polio cases in complete year}}{\text{Total number of Months}}=\dfrac{192}{12}=16$
Mean number of Polio patients per month in 2023
Sum of Polio cases in complete year $=\dfrac{\text{Sum of polio cases in complete year}}{\text{Total number of Months}}=\dfrac{144}{12}=12$
Difference of Polio patients per month detected in 2022 and 2023 $=16-12=04$
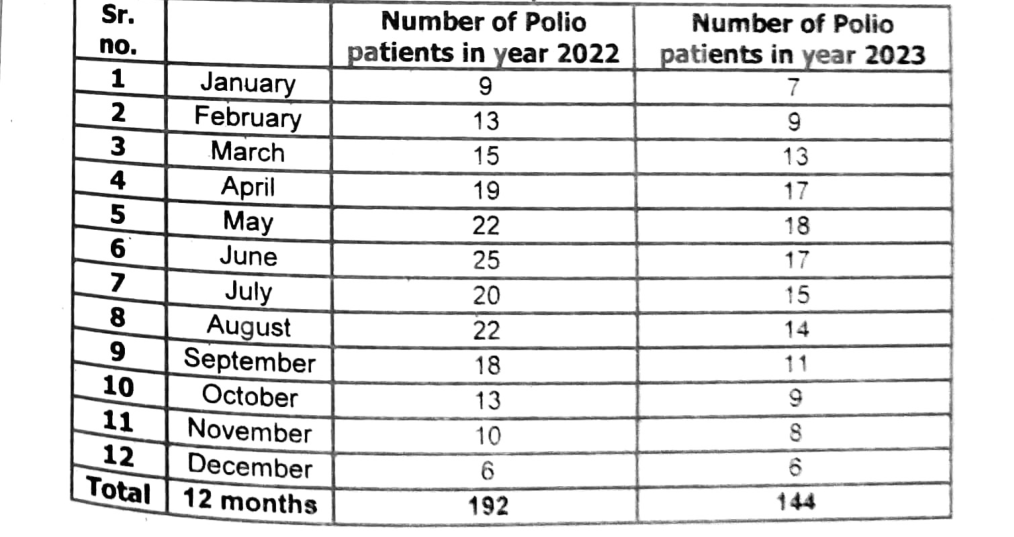
Prevalence of Polio disease decreased in 2023 compared to 2022 by 04 patients per month.
| Sr. No. | Mass (Lbs) | Frequency ($f$) | Mean of limits ($x=\dfrac{\text{Lower limit}+\text{Upper limit}}{2}$) | Frequency × mean of limits ($fx$) |
|---|---|---|---|---|
| 1 | 35–39 | 13 | $\dfrac{35+39}{2}=37$ | $13\times37=481$ |
| 2 | 40–44 | 15 | $\dfrac{40+44}{2}=42$ | $15\times42=630$ |
| 3 | 45–49 | 28 | $\dfrac{45+49}{2}=47$ | $28\times47=1316$ |
| 4 | 50–54 | 17 | $\dfrac{50+54}{2}=52$ | $17\times52=884$ |
| 5 | 55–59 | 12 | $\dfrac{55+59}{2}=57$ | $12\times57=684$ |
| 6 | 60–64 | 15 | $\dfrac{60+64}{2}=62$ | $10\times62=620$ |
| 7 | 65–69 | 05 | $\dfrac{65+69}{2}=67$ | $05\times67=335$ |
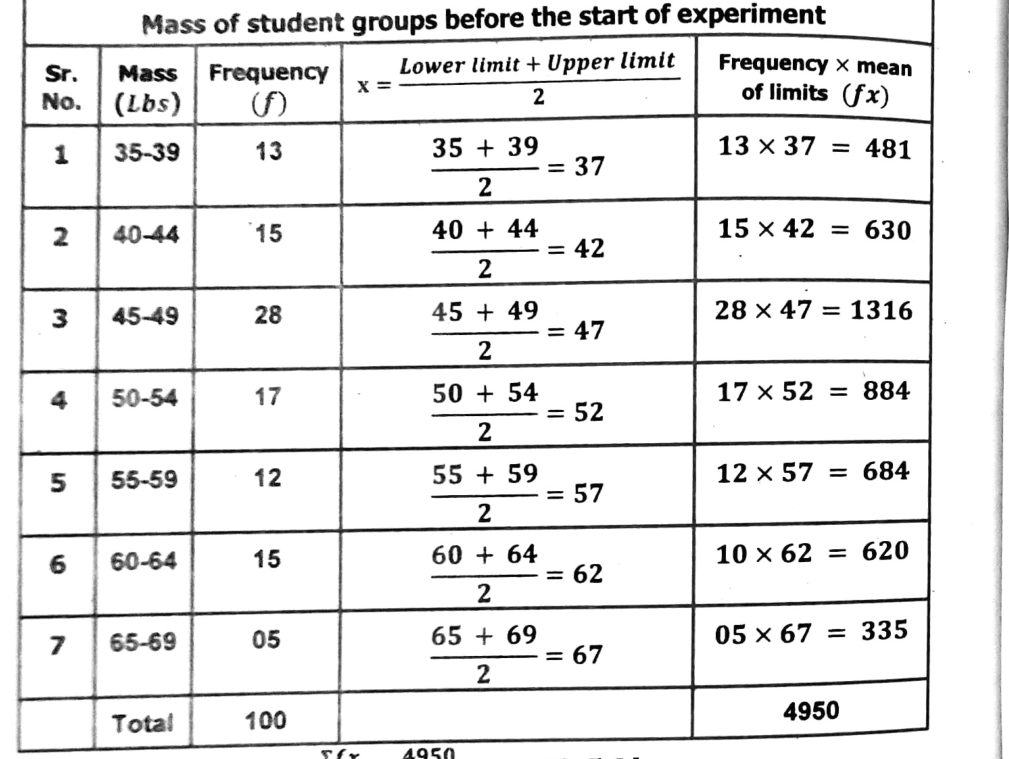
| Total | 100 | 4950 |
Calculations:
$\bar{x}=\dfrac{\sum fx}{\sum f}=\dfrac{4950}{100}=49.5\ \text{Lbs}$
49.5 Lbs is the mean mass of 100 students of different groups before the start of experiment.
Median
Definition
The median is the middle value in a dataset that are arranged in ascending or descending order of magnitude. Median divides the data set into two equal parts. One part of the dataset have the values less than the middle value and the other part of the dataset have values greater than the middle value. It is denoted by $\tilde{x}$ (read as “x tilde” or “x snake”). It is necessary to arrange the values of dataset in ascending or descending order. The methods of calculating the median are simple and the value of median is not affected by change in extreme values of dataset.
Median for un-group data
- If the number of values is odd, the median is the middle value.
Median ($\tilde{x}$) = the value of the $\left(\dfrac{n+1}{2}\right)^{\text{th}}$ item in the dataset (where $n$ = number of items or data). - If the number of values is even, the median is the average of the two middle values.
Solution: The median is calculated as follows
The measured heights of plants after arranging in ascending order are as given below:
46, 49, 55, 58, 62, 63, 64, 65, 66, 67, 68, 70, 72
Number of values in the dataset of observed heights = 13
Median ($\tilde{x}$) $=\dfrac{n+1}{2}=\dfrac{13+1}{2}=\dfrac{14}{2}=7$ (i.e. value of 7th value in datasheet)
Median ($\tilde{x}$) = 64
Example: Median ($\tilde{x}$)
For the dataset with even number of values
Median ($\tilde{x}$) $=\dfrac{\left(\dfrac{n}{2}\right)^{\text{th}}\text{ term}+\left\{\left(\dfrac{n}{2}\right)+1\right\}^{\text{th}}\text{ term}}{2}$
Dataset: The number of fruits produced on each of the 16 plants of experimental group are recorded as below:
3, 5, 18, 21, 15, 10, 8, 12, 13, 7, 11, 14, 9, 16, 20, 24
Find out the median value of fruits produced per plant.
Solution
The numbers of fruits produced on 16 plants after arranging the values of dataset in ascending order are given below:
3, 5, 7, 8, 9, 10, 11, 12, 13, 14, 15, 16, 18, 20, 21, 24
Total number of values in the above given dataset $n=16$ (even number)
Median ($\tilde{x}$) $=\dfrac{\left(\dfrac{n}{2}\right)^{\text{th}}\text{ term}+\left\{\left(\dfrac{n}{2}\right)+1\right\}^{\text{th}}\text{ term}}{2}=\dfrac{\left(\dfrac{16}{2}\right)^{\text{th}}\text{ term}+\left\{\left(\dfrac{16}{2}\right)+1\right\}^{\text{th}}\text{ term}}{2}$
Median ($\tilde{x}$) $=\dfrac{(8\text{th term})+(8\text{th term}+1)}{2}=\dfrac{(8\text{th term})+(9\text{th term})}{2}$
Read off the 8th and 9th values:
- 8th value = 12
- 9th value = 13
Median ($\tilde{x}$) $=\dfrac{12+13}{2}=\dfrac{25}{2}=12.5$ fruit per plant
For extra reading material and advance practice
Median for grouped data
(i) Discontinuous or unconnected values in a dataset:
To calculate the median for discontinuous grouped data, first obtain the cumulative frequency (cf) of the complete dataset. The value of the data against the relevant cumulative frequency gives the median.
For a dataset with an odd number of values:
Median ($\tilde{x}$) = value of data against the $\left(\frac{n+1}{2}\right)^{\text{th}}$ cumulative frequency.
For a dataset with an even number of values:
Median ($\tilde{x}$) = $\dfrac{\text{class value against the }\frac{n}{2}^{\text{th}}\text{ cumulative frequency} + \text{class value against the }\left(\frac{n}{2}+1\right)^{\text{th}}\text{ cumulative frequency}}{2}$.
Example for an odd-numbered dataset
Calculate the median of the following dataset obtained by counting the number of flowers on 21 rose plants.
| Class (no. of flowers/plant) | Frequency (no. of plants) | Cumulative frequency |
|---|---|---|
| 1 | 3 | 3 |
| 2 | 5 | 8 |
| 3 | 6 | 14 |
| 4 | 4 | 18 |
| 5 | 3 | 21 |
Number of plants ($n$) = 21
Median ($\tilde{x}$) = $\left(\frac{n+1}{2}\right)^{\text{th}}$ cumulative frequency = $\frac{21+1}{2}=11$.
Since cumulative frequency 11 is included in cumulative frequency 14, which represents class value 3, the median is 3.
Example for an even-numbered dataset
Calculate the median for the following data recorded for the height (in cm) of 80 plants.
| Class (plant height in cm) | Frequency (no. of plants = $n$) | Cumulative frequency |
|---|---|---|
| 119 | 4 | 4 |
| 120 | 9 | 13 |
| 121 | 14 | 27 |
| 122 | 18 | 45 |
| 123 | 15 | 60 |
| 124 | 13 | 73 |
| 125 | 7 | 80 |
Number of plants ($n$) = 80
Median ($\tilde{x}$) = $\dfrac{\text{class values against the }\frac{n}{2}^{\text{th}}\text{ and }\left(\frac{n}{2}+1\right)^{\text{th}}\text{ cumulative frequencies}}{2}$
Median ($\tilde{x}$) = $\dfrac{\text{class values against cumulative frequencies 40 and 41}}{2}$.
The class values for cumulative frequencies 40 and 41 are included in the class value for cumulative frequency 45, which is 122.
Total $n=80$, so $\frac{n}{2}=40$. The 40th and 41st observations both fall in the class where the cumulative frequency just equals or exceeds 40, namely at height 122 cm (since the cumulative frequency at 121 cm is 27 and at 122 cm is 45).
Therefore, Median ($\tilde{x}$) = 122.
Activity: (to be solved by the students)
Calculate the median of the following values of a dataset obtained by measuring the heights of 22 plants in an experimental group to assess the effects of less water availability:
8, 9, 10, 18, 10, 8, 9, 7, 8, 11, 23, 19, 17, 15, 7, 12, 14, 12, 11, 14, 15, 13.
Solution
Dataset, sorted in ascending order:
7, 7, 8, 8, 8, 9, 9, 10, 10, 11, 11, 12, 12, 13, 14, 14, 15, 15, 17, 18, 19, 23
Total number of values in the dataset: $n=22$ (even number).
Median ($\tilde{x}$) = $\dfrac{\left(\frac{n}{2}\right)^{\text{th}}\text{ term} + \left(\left(\frac{n}{2}\right)+1\right)^{\text{th}}\text{ term}}{2}$.
Median ($\tilde{x}$) = $\dfrac{(11^{\text{th}}\text{ term})+(12^{\text{th}}\text{ term})}{2}$.
Read off the 11th and 12th values:
- 11th value = 11
- 12th value = 12
Median ($\tilde{x}$) = $\dfrac{(11)+(12)}{2}$
Median ($\tilde{x}$) = $\dfrac{11+12}{2} = \dfrac{23}{2} = 11.5$
Therefore, the median plant height in this dataset is 11.5.
Mode
Definition
The mode is the value in a dataset that appears the maximum number of times. A dataset may have one mode (unimodal), more than one mode (bimodal or multimodal) or no mode at all (amodal), i.e. all values occur the same number of times. It may be denoted by $\hat{x}$ (read as “x-hat” or “x cap”). Mode = the most frequent or repeated value occurring in a given dataset.
Formula for calculating Mode for Group data:
$$\text{Mode }(\hat{x})=l+\left[\frac{(f_m-f_1)\times h}{(f_m-f_1)+(f_m-f_2)}\right]$$
Where:
- $l$ = lowercase boundary of model group
- $f_m$ = maximum frequency of a group
- $f_1$ = previous frequency of $f_m$
- $f_2$ = next frequency of $f_m$
- $h$ = class interval of model group
Example #01
Find the mode from the word “BIOLOGY”.
Mode ($\hat{x}$) = the most repeated value of the data. Mode ($\hat{x}$) = “O”
Example #02
Find mode from the following data: 3, 5, 6, 6, 9, 10, 9, 6, 6.
Mode ($\hat{x}$) = the most repeated value of the data. Mode ($\hat{x}$) = 6
Example #03
Find the mode from the following data: 3, 5, 5, 6, 9, 9, 10, 12.
Mode ($\hat{x}$) = the most repeated value of the data.
Mode ($\hat{x}$) = 5, 9
Example #04
Find the mode from the following frequency distribution:
| Groups | Frequency ($f$) | Class Boundary (CB) | |
|---|---|---|---|
| 10–19 | 5 | 9.5–19.5 | |
| 20–29 | 25 ($f_1$) | 19.5–29.5 | |
| 30–39 | 40 ($f_m$) | 29.5–39.5 | → (model group) |
| 40–49 | 20 ($f_2$) | 39.5–49.5 | |
| 50–59 | 10 | 49.5–59.5 |
$$\text{Mode }(\hat{x})=l+\left[\frac{(f_m-f_1)\times h}{(f_m-f_1)+(f_m-f_2)}\right]$$
$l=29.5,\quad f_m=40,\quad f_1=25,\quad f_2=20,\quad h=10$
$$\text{Mode }(\hat{x})=29.5+\left[\frac{(40-25)\times10}{(40-25)+(40-20)}\right]=29.5+\left[\frac{(15)\times10}{(15)+(20)}\right]$$
$$\text{Mode }(\hat{x})=29.5+\left[\frac{150}{35}\right]=29.5+4.286$$
$$\text{Mode }(\hat{x})=33.786$$
Graphic presentation of scientific data: Need and its importance
Biostatistical values (data) are documented in the form of figures and are usually recorded in the form of tables. But numerical or arithmetical figures are usually not attractive. Large numbers of figures in tables are not easily understandable. It seems difficult to get a clear picture from the numerical data. Diagrams and graphs are a comparatively more attractive way of presenting the clear and complete picture of data. Moreover, data information presented in the form of diagrams, pictures, charts and graphs leave a long-lasting impression on the mind of the observer. Multiple types of graphs, pictures and diagrams are used in representing data, including bar-chart, rectangles and pie-chart.
Simple bar diagram or simple bar chart
Simple bar charts have bars which are drawn to represent a single data without further classification of the characteristics. Bar charts represent only one characteristic of the data. One bar represents only one value or figure and there may be multiple bars representing many values or figures. In a simple bar chart, bars of equal width are drawn, but their lengths are variable. Heights of length of the bars represent the magnitude of a quantity or degree of value in the data.
Some basic steps in sketching of bar charts
- Take graph paper with suitable sizes and scales as per requirement and type of data.
- Draw two lines on the graph, perpendicular to each other and intersecting at zero.
- Label the axes of the graph: the horizontal line is the x-axis and the vertical line is the y-axis.
- Choose uniform width of bars and uniform gap between the bars along the horizontal axis (X-axis).
- Label the x-axis with the names of the data items whose values are to be presented.
- Choose a suitable scale to determine and specify the heights of the bars for the given values along the vertical axis (y-axis).
- Label the y-axis scale with specific unit of data value to grade the length of bars.
- Calculate the heights of the bars according to the scale chosen and mark as dots.
- Draw the bars carefully and recheck all the entries. Bars in the graph may be drawn vertically or horizontally but normally vertical bars are used.
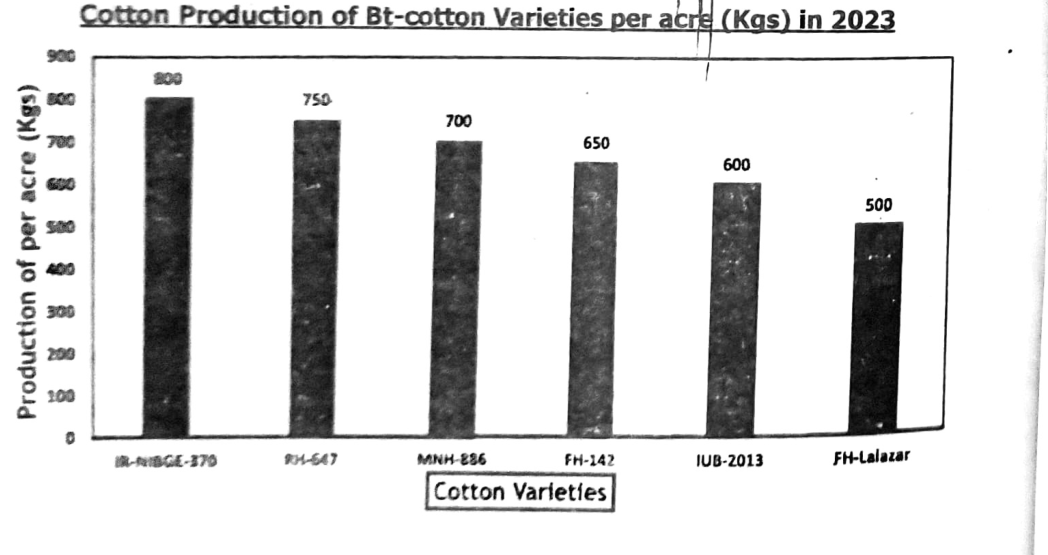
Draw simple bar graph/chart to represent the cotton (weight in Kgs) produced per acre of land from five Bt cotton varieties (IR-NIBGE-370, RH-647, MNH-886, FH-142, IUB-2013 and FH-Lalazar) in year 2023.
| Cotton Varieties | IR-NIBGE-370 | RH-647 | MNH-886 | FH-142 | IUB-2013 | FH-Lalazar |
|---|---|---|---|---|---|---|
| Production per acre (Kgs) | 800 | 750 | 700 | 650 | 600 | 500 |
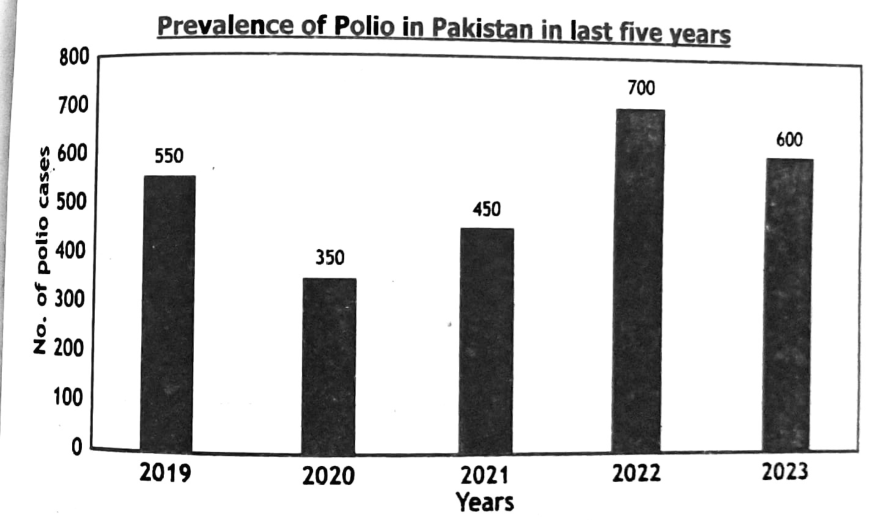
Draw simple bar graph/chart to represent the prevalence of polio, showing number of confirm polio cases in Pakistan in last five years (2019-2023).
| Years | 2019 | 2020 | 2021 | 2022 | 2023 |
|---|---|---|---|---|---|
| No. of polio cases | 550 | 350 | 450 | 700 | 600 |
SUMMARY
- Application of statistical methods and principles to analyse and interpret the findings of biological, medical and health sciences is called Biostatistics.
- Biostatistics mainly deals with the collection, analysis and interpretation of data associated to living organisms and then presentation of findings for possible plans or solutions.
- Components of Biostatistics include identification of problem, designing experiments, collecting and analysing data, interpreting results, developing new tools.
- Biostatistics is useful in Agriculture, cattle farming, Medical and Pharmacological Research, Epidemiological studies and Policy Development, Management of Public Health, Genetic diseases, Pollution indicators and Environmental protection and Survival Analysis.
- Average is a single value which is calculated to represent the whole data.
- Types of averages: Arithmetic Mean, Median, Mode, Geometric mean and Harmonic mean.
- Mean is the sum of all the values of data set divided by the total number of values in the data set. The symbol is $\bar{x}$.
$$\text{Mean}=\frac{\text{sum of values}}{\text{Total numbers of values}}$$ - The median is the middle value in a dataset that are arranged in ascending or descending order of magnitude.
- The mode is the value in a dataset that appears maximum number of times, it is denoted by $\hat{x}$. Mode = the most frequent or repeated value occurring in a given dataset.
- Biostatistical data is documented in the form figures and tables. Data information presented in the form of diagrams, pictures, charts and graphs leave long lasting impression on the mind of the observer.
- Multiple types of graphs, pictures and diagrams are used in representing data including bar-chart, rectangles and pie-chart.